A Botanical Exploration as a Biological Science Technician for the Bay Area National Park Service
During my 2021 field season, we surveyed a diverse range of newly established long term monitoring plots with Point Reyes, Golden Gate, and Pinnacles National Parks. The ecosystem types include Annual Grasslands, Coastal Dune Scrub, Coast Live Oak Woodlands, Deschampsia Grasslands, and Douglas Fir Forest post-fire.
Questions to consider along the way: What can I learn from the plots I am sampling? What is the land teaching me? What observations do I notice? Are there any trends I am seeing? How and why do the plant species of different locations vary? Are there any similarities between parks? What “invasive” species are congruent throughout the parks? What rare or threatened species were encountered? How does this data I am collecting contribute to our understanding of the ecosystem?
Annual Grassland Monitoring at Pinnacles – May 2021


Coastal Dune Scrub Monitoring in Point Reyes – May 2021


Coast Live Oak Woodland Plots (Poison Oak Forests)
One aspect of the job I am enjoying is being up close to the Oak Forests riddled with Phytothera, or the fungus associated with Sudden Oak Death. I am learning the symptoms that may indicate if the tree has been infected. The symptoms include Structural failure, Hypoxylon or Black Dog Nose Fungus, and Beetle Boring Dust.
Reflection: I was naive during my interview when they asked me if I was okay with poison oak and tick exposure. If I only would have known that this exposure would later mean monitoring plots engulfed in a poison oak forest. Vines encased around all the trees, leaves of three dangling at eye level everywhere you go. If getting poison oak rash all over my body continuously throughout the job was not enough, sometimes I am lucky enough to find a tick crawling on me while laying in bed, a leftover hitchhiker from the earlier workday. Next time, I will ask more questions during the interview about what the day-to-day will be like in the field.
For a visual watch this video IMG_1518


Douglas Fir Post 2020 Fire Burned Plots in Point Reyes


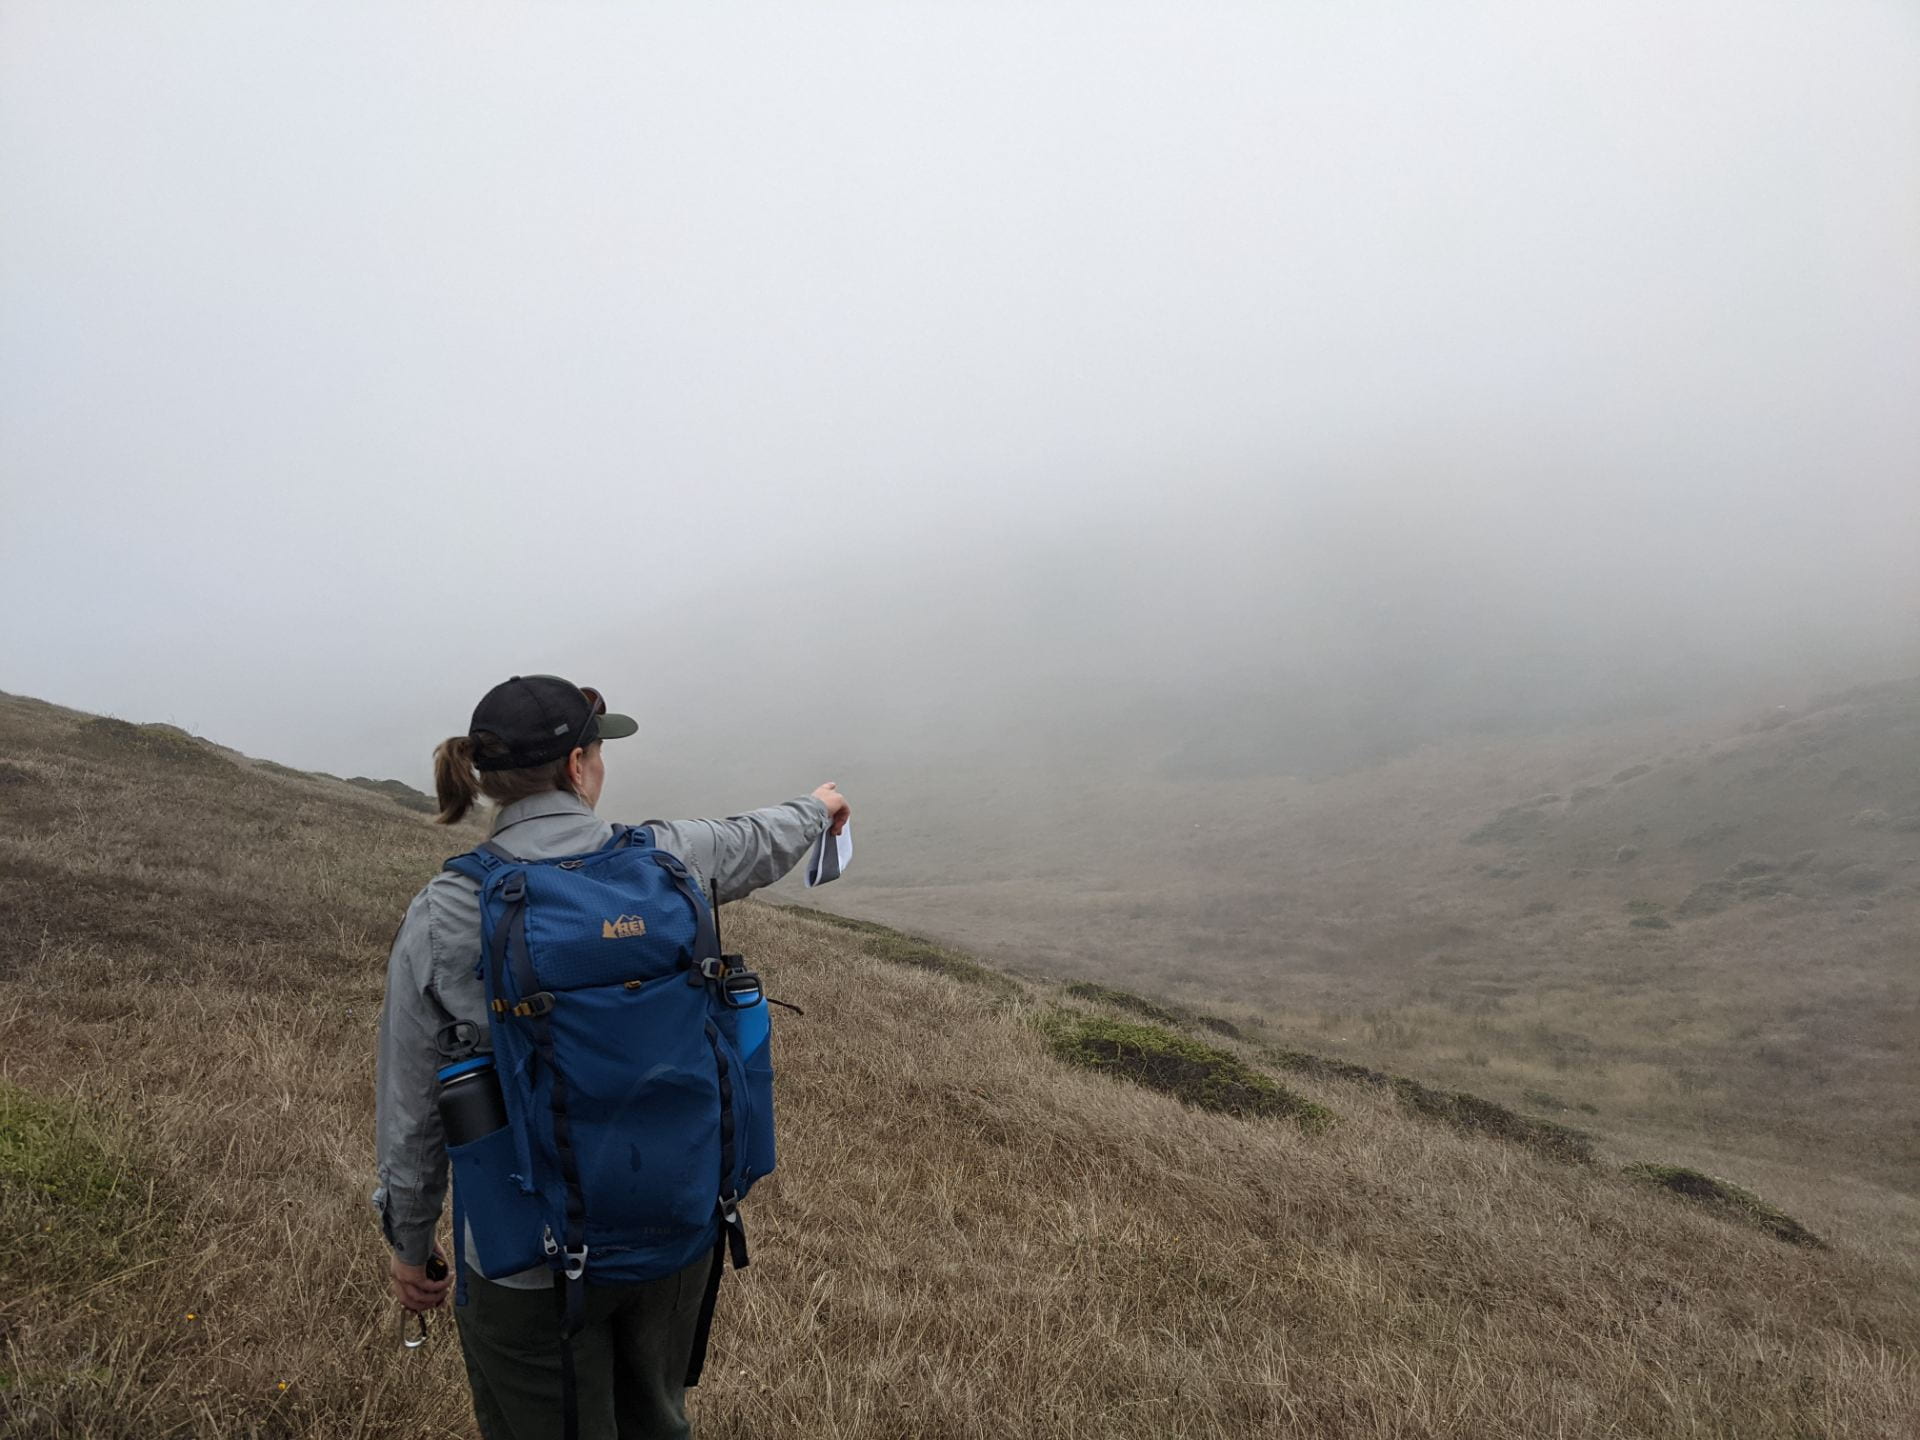
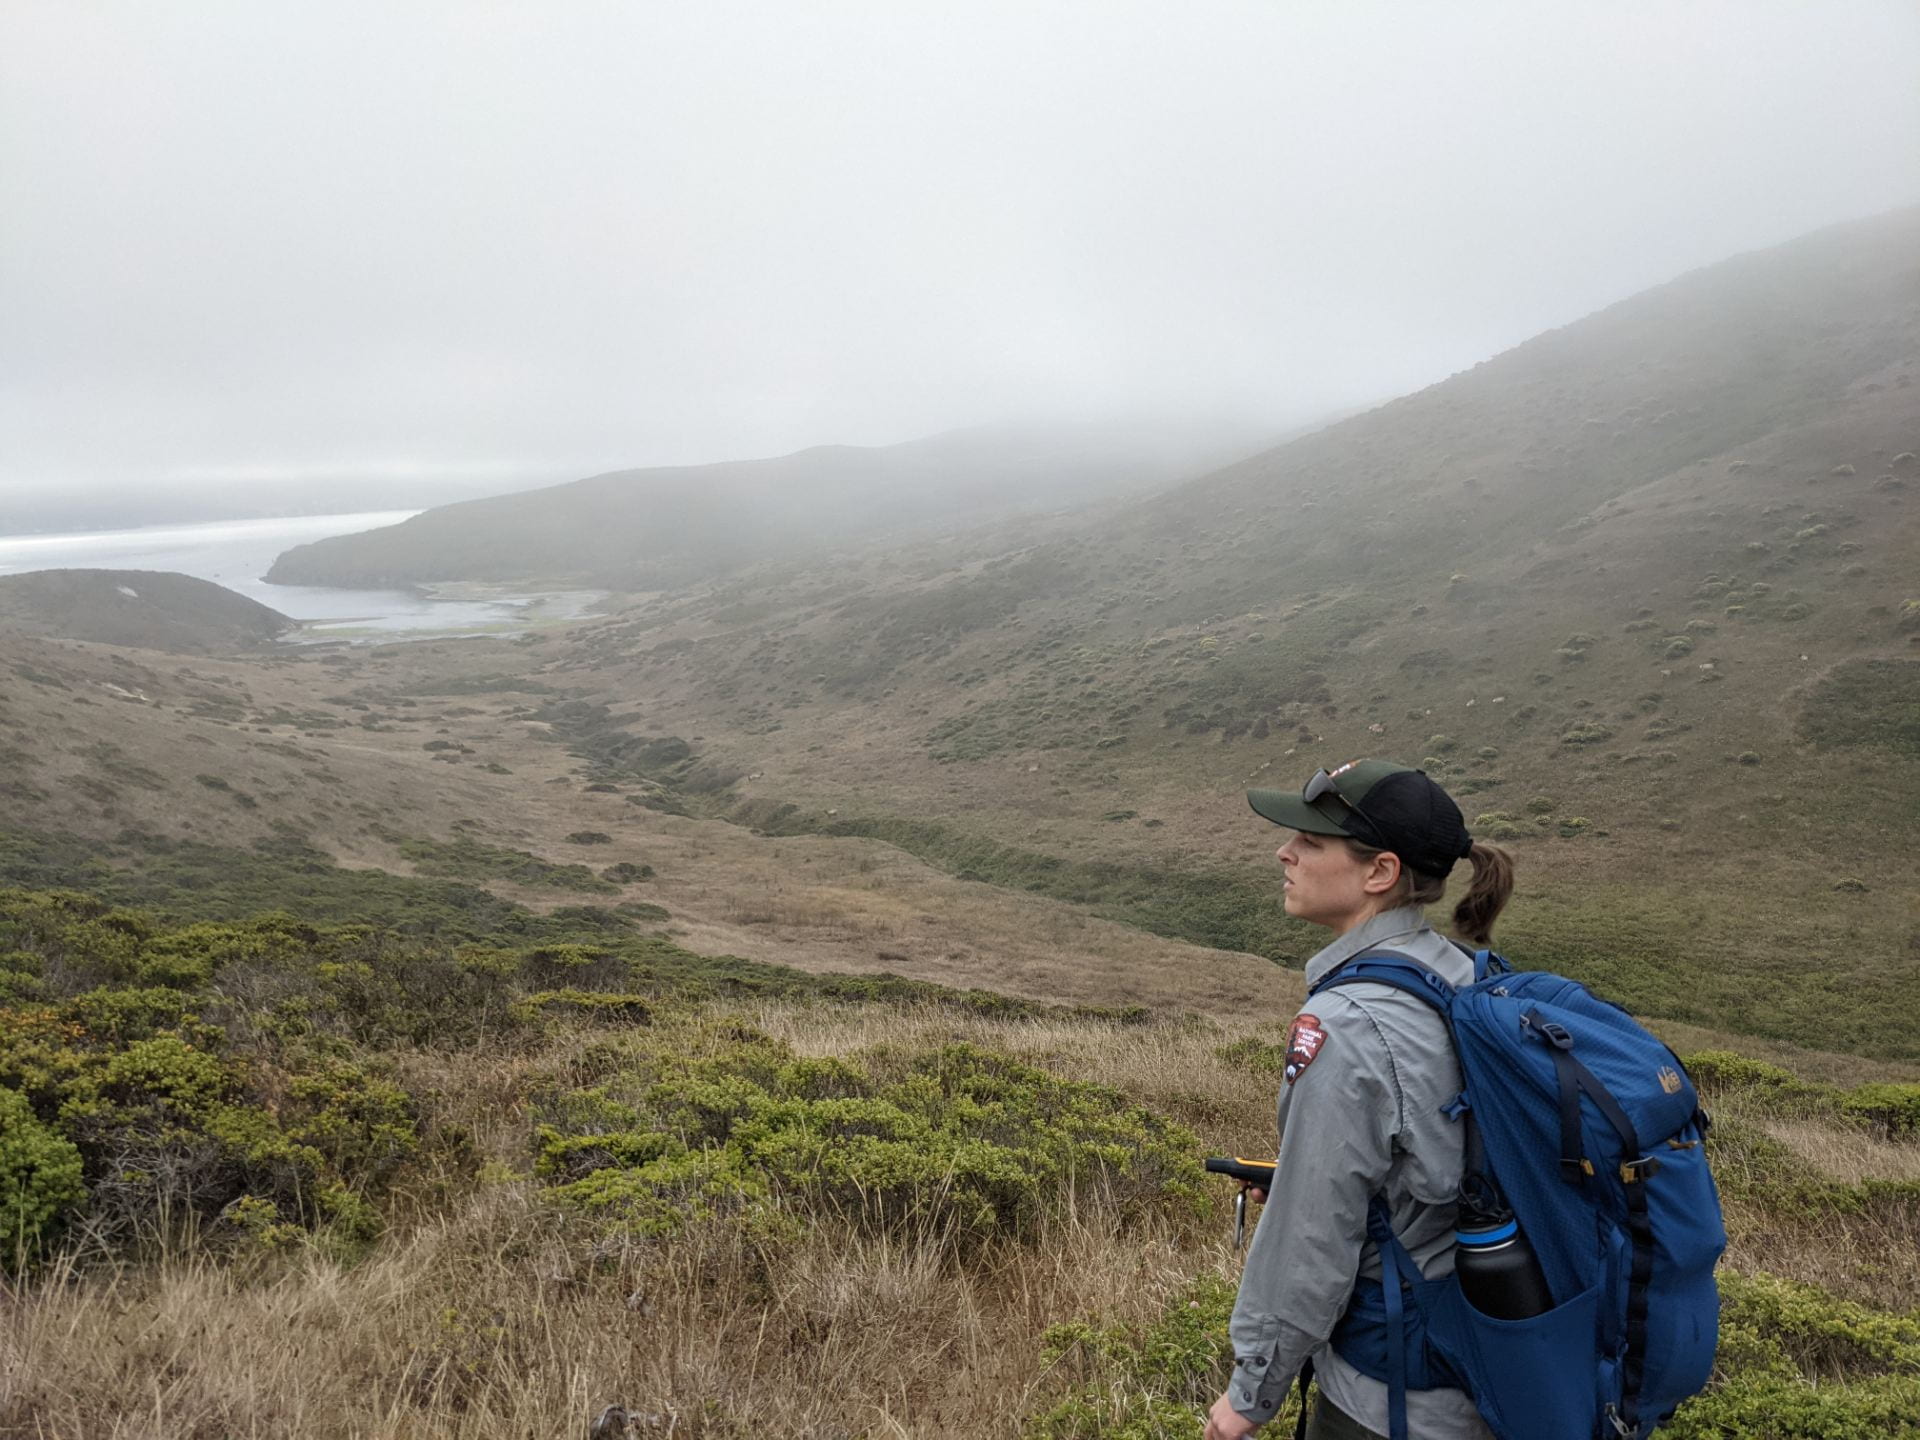
Deschampsia Grasslands by the sea – Coastal Terrace Prairie
Coastal Terrace Prairie is similar to Coastal Bald Hills Prairie, differing in water availability. Coastal Terrace Prairie receives more moisture, usually in the form of summer fog. According to SFAN Scientists, the mosaic of Coastal Terrace Prairie and Coastal Bald Hills Prarie are dynamically changing in the absence of disturbance regimes like fire or grazing. Since fog is estimated to decrease with climate change in this locale, the ecology of the Coastal Terrace Prarie will be significantly disupted.
Both Coastal Terrace Prairie and Bald Hills Prairie are home to the endangered Mission Blue Butterfly. In addition, Coastal Terrace Prairie has a high number of special status plants and animals, including Myrtle’s Silverspot Butterfly and Trifolium amoenum. Habitat of these ecosystems has shrunken dramatically with the onset of colonization, following increases in overgrazing by cattle ranching and development. There are 6 federally recognized endangered or threatened plant species in Coastal Terrace Prarie. One species I surveyed was Castilleja ambigua ambigua, which has a CNPS rank of 4.2. 
According to the 2015 SFAN Analysis Report of Coastal Terrace Prairie, the average number of taxa in the 7.32m radius circle was 38.8, and 29.1 taxa in the 1 square meter quadrats. Of all taxa observed, approximately 72.7% were native, and 27.3% were introduced. Contrasting yet similar, the nearby habitat of Bald Hills Prairie is home to 32 taxa in the larger 7.32m radius, and 21.9 taxa in the 1 square meter quadrat.
In the Bald Hills Praire, some species occurred in 100% of all plots, including Avena barbata, Briza maxima, and Hypochaeris radicata. Plantago lanceolata, a European introduced species, has the highest percent coverage of 8.9% within the Blad Hills Prairie. In Coastal Terrace Prarie, Deschampsia, a native perennial grass, constituted 30% of all estimated cover. Plantago lanceolata was the second most abundant plant with a 24.4% estimated cover. In total, 17 invasive plant species were identified in plots, and 11 of them were rated as moderate by Cal-IPC, meaning they cause substantial ecological impacts. Two high priority species include Purple False Brome (Brachypodium disachyon) at 7.1% and Rosy Sandcrocus (Romulea rosea australis) at 21.4% frequency in plots.
How did drought impact this community? 2012-2015 were record-breaking drought years for California. This translated to below-average vegetative growth across nearly all taxonomic groups, below average germinations of seedlings, and senescence (or annual plant die back) occurred 1-2 weeks earlier than the average.
Many native plants are not abundant compared to their populations before colonization. The land was stewarded carefully by the indigenous peoples to achieve certain ecological goals, like improved plant abundance or hunting grounds. How would returning indigenous land stewardship to these ecosystems benefit the native populations? Would re-introducing a fire regime to the landscape simultaneously limit the growth of introduced plants?


Office work – data entry and herbarium processing

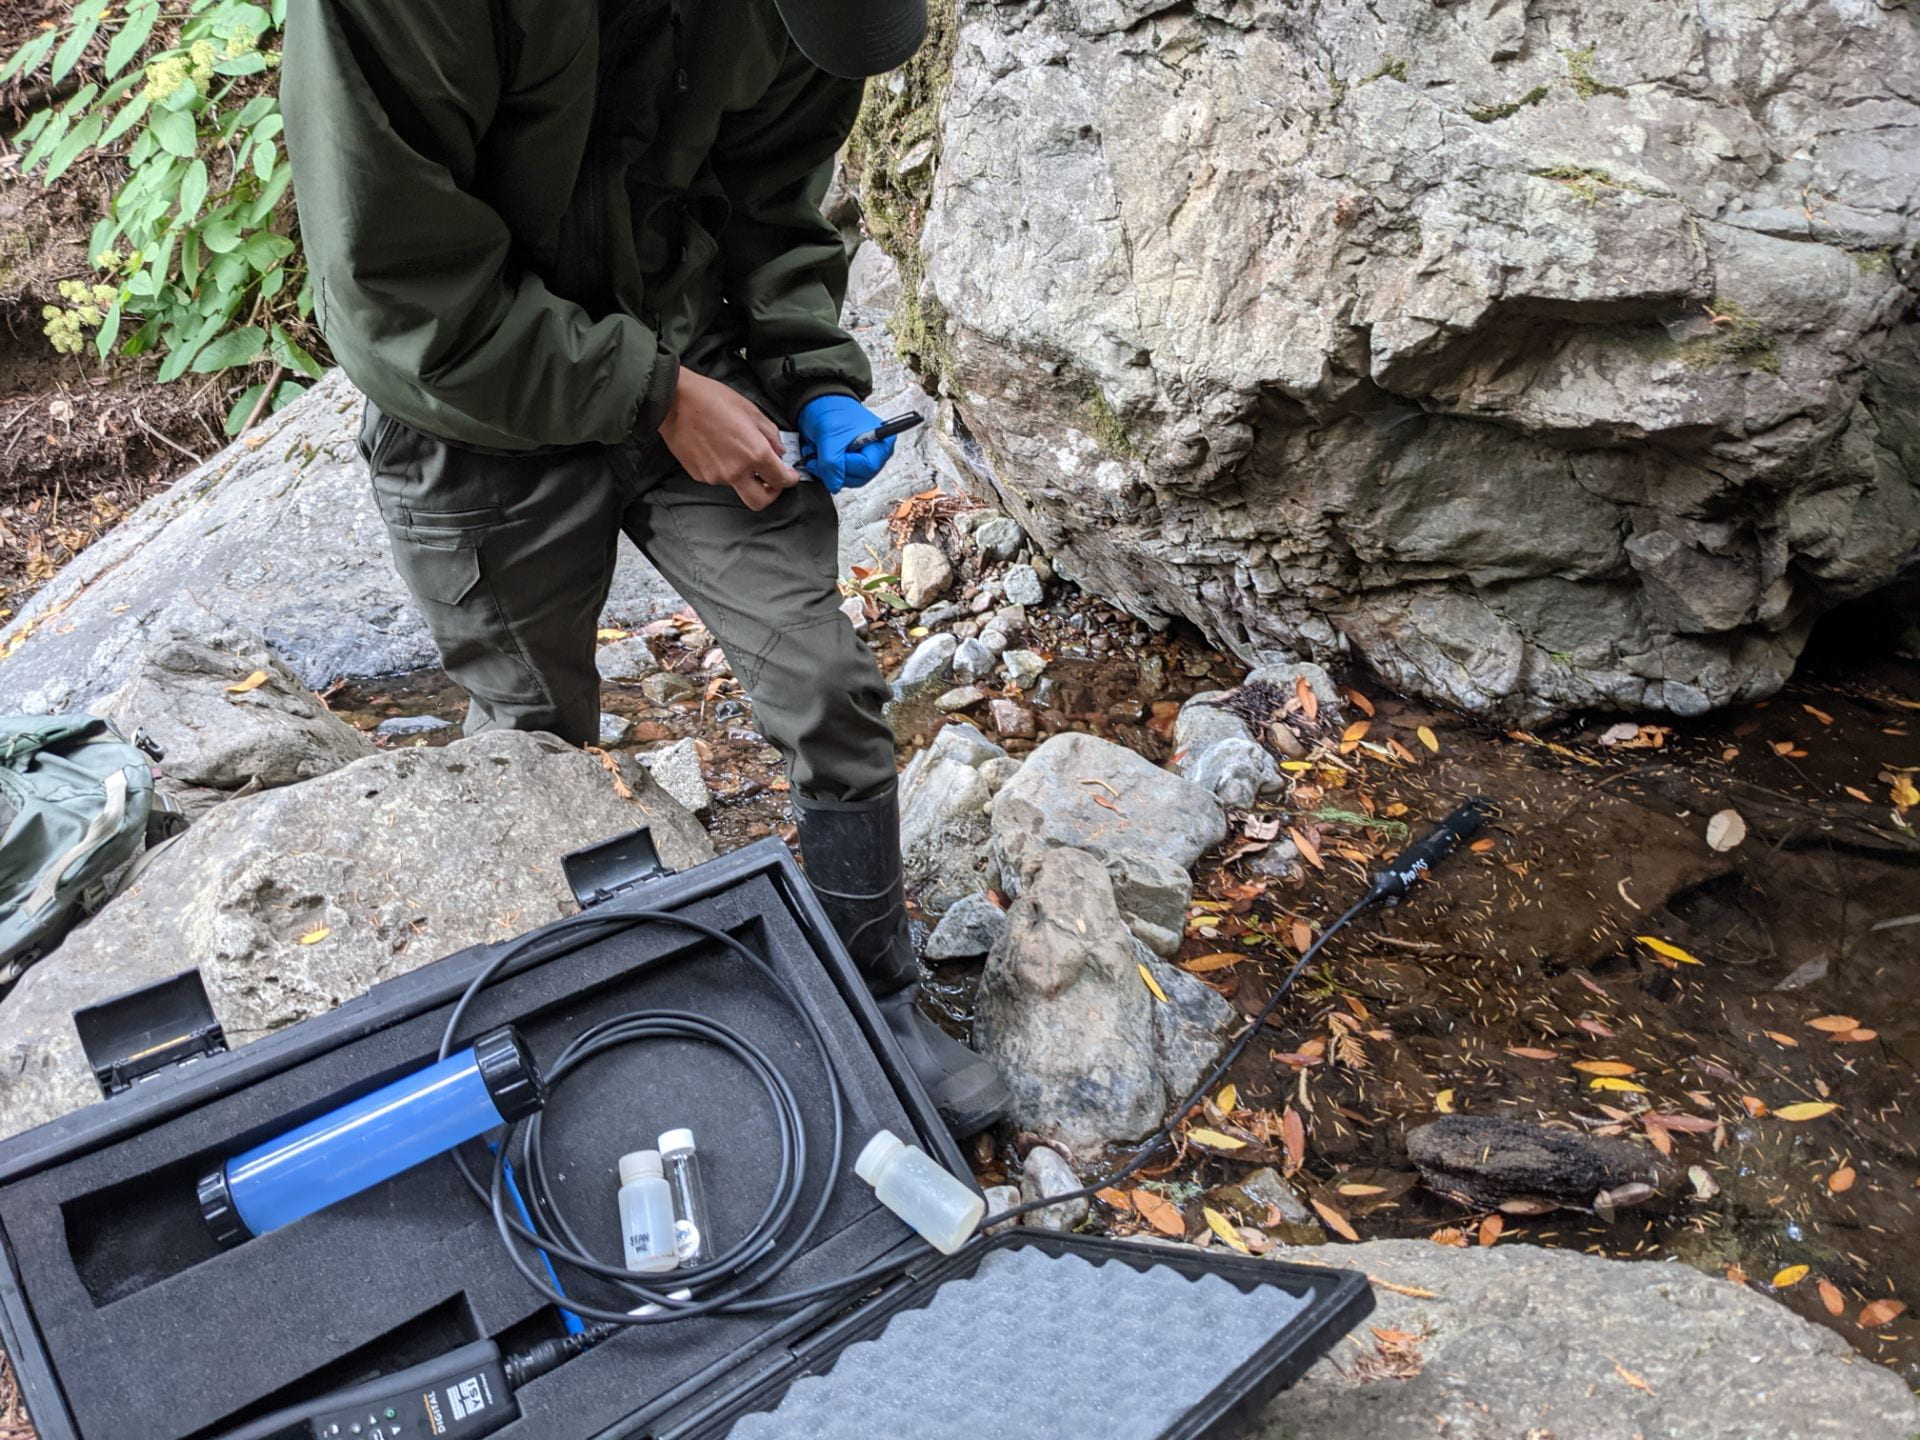
Water Quality Monitoring near Muir Woods
I helped the Water Quality technician collect data for the SFAN Inventory and Monitoring Wate Quality Program. Many variables were tracked, including Dissolved Oxygen Demand, turbidity, and the presence of pathogens like Ecoli.